The BUS Methodology is a powerful tool in the development of quality, user centered building design.
Identifying features that both work well and may be improved, acting as a tool for optimising operational buildings so that they are more satisfying for occupants.
Consistent evaluation before and after an intervention (eg. office move or lighting upgrade), demonstrating success.
From a study of a single building, to explorative statistical analyses across 10,000's of records, lessons are learned that challenge better design.
A recognised tool for post-occupancy evaluation contributing towards BREEAM, LEED, WELL Standard, NABERS and Soft Landings.
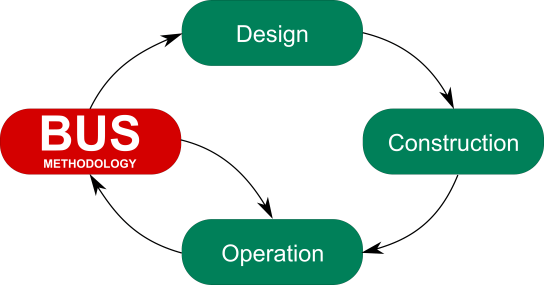
BUS Methodology surveys are usually tailored to each project. However, a typical process may follow the steps below.
Select a BUS Methodology Partner to guide you through the survey process and advise on the key decisions. The BUS methodology is licensed only to trained and experienced partners. Our partners will guide you in the best way to carry out the surveys and interpret the results. You can choose from paper or internet based surveys. Best results are obtained when all questions are asked, but certain questions can be omitted as it is recognised that some are not appropriate in all situations.
Distribute an appropriate version of the BUS Methodology questionnaire.The questionnaire typically takes 5-15 minutes to complete. It contains up to 45 quantitative and qualitative questions and seeks views on aspects such as: Thermal comfort and ventilation, lighting and noise, personal control, space, design and image. In commercial buildings occupants are asked about their perceived productivity and how they travel to the building. In domestic buildings, occupants are asked about their lifestyle and environmental issues.
Questionnaire responses for the building are compared to a benchmark building set from the BUS Methodology database
Results are presented in a number of ways: Summary results give a snapshot view of overall building performance. Results for each question are reported using statistical tables, graphs and plots. Slider graphics with traffic light markers are used for ease of interpretation. Anonymised narrative comments are reported. Your BUS methodology partner can interpret the results and put them into context for your building.
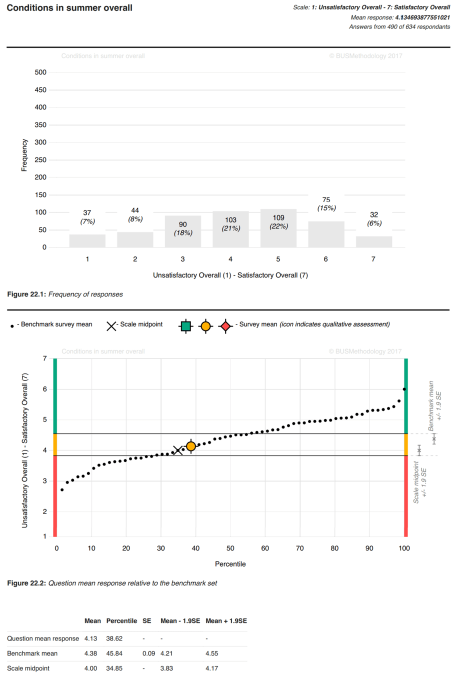
The results to each survey are compared to standardised benchmarks derived from the BUS Methodology building performance database to provide an indication of how the building performs relative to it's peers.
Benchmark samples are usually selected of common use type and/or geographical region.
The BUS methodology has been created from thirty years of continuous development in building use studies.
The method was developed and refined during the 1990's, when it was used for the seminal series of Government funded PROBE building performance evaluation studies regularly published in the industry press.
Since 1995 the BUS Methodology was curated and managed by Adrian Leaman.
Arup acquired the BUS Methodology in 2009 and worked with Adrian to establish the BUS Partner Network in 2013.